Summary: A date comparison option has been available in Analytics for years, but many of us have wondered why it was never available inside of Adwords as well. Well, it seems that Google has heard the request because today the feature was added... but don't get too excited - it's very limited on features at this point. At least it's a step in the right direction.
If you're like me, you've been wishing for years that Google would allow us to compare date ranges in Adwords the same way we can in Analytics. Well, it looks like our prayers have finally been answered... sort of.
Today while I was just checking in on a couple of client campaigns I noticed that the calendar looked a little different when selecting a custom date range. Nothing dramatic jumped out at me, but it looked like some minor cosmetic changes had been made. This struck me as a little odd mainly because a whole
new interface had rolled out just a few months ago, but it was still a minor tweak. Then I saw the little "Compare dates" button and probably got a little more excited than I should have (I may have said "sweet!" under my breath, but still audibly).
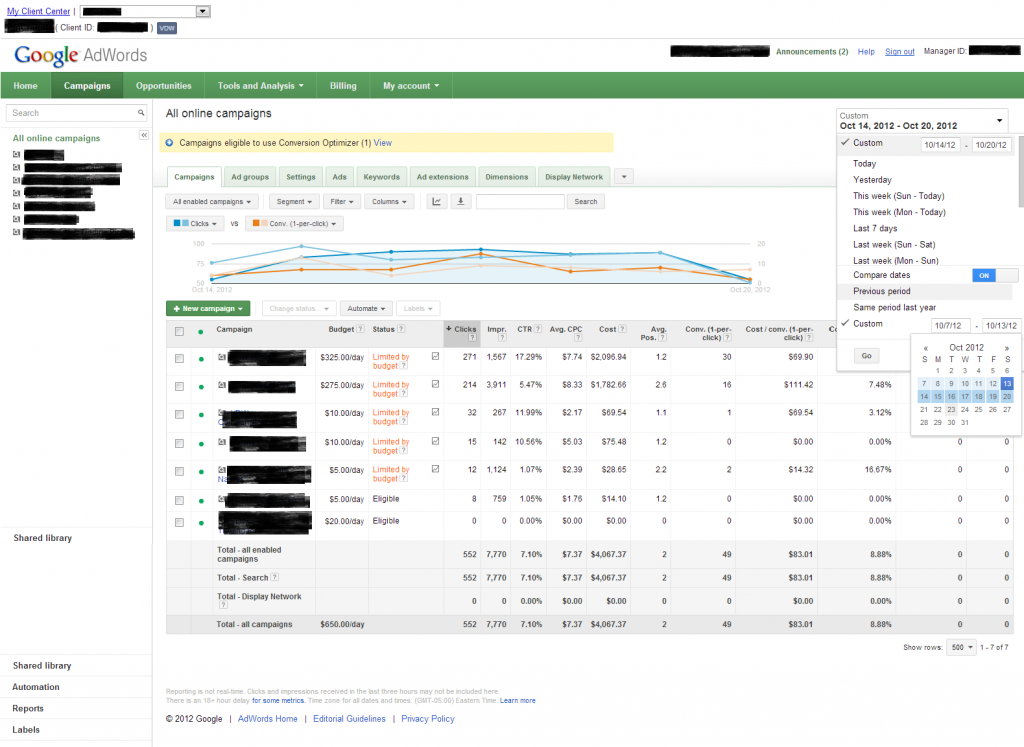
Check it, first here at the account level (click to enlarge):

In the screenshot above you can see both the new "Compare dates" option and the new look of the calendars, as well as the resulting graph that is created. Unfortunately, that graph is the only place we're shown comparison data, and you have to mouse over each individual day to see daily comparison's. There's no way, for example, to compare metrics from September to August in the aggregate - it's all daily. But I think we can all agree that daily comparisons won't tell us much (we could be comparing different days of the week, holidays to non-holidays, etc.), and we get a much better sense of Adwords campaign performance by looking at larger data sets.
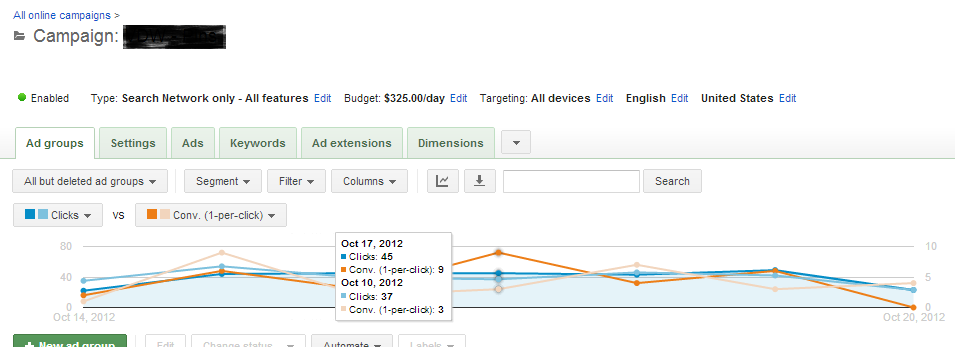
Before I commence further whining about this *feature*, let's take a look at a screenshot of one of these graphs when you're drilled down to an individual campaign and mousing over a date:

I'm thrilled to see a substantial increase in clicks and conversion last Wednesday over the previous Wednesday, but what was the percentage increase? Having some change data is obviously better than nothing, but why couldn't they have included green and red increase/decrease percentages like we have access to in Analytics?
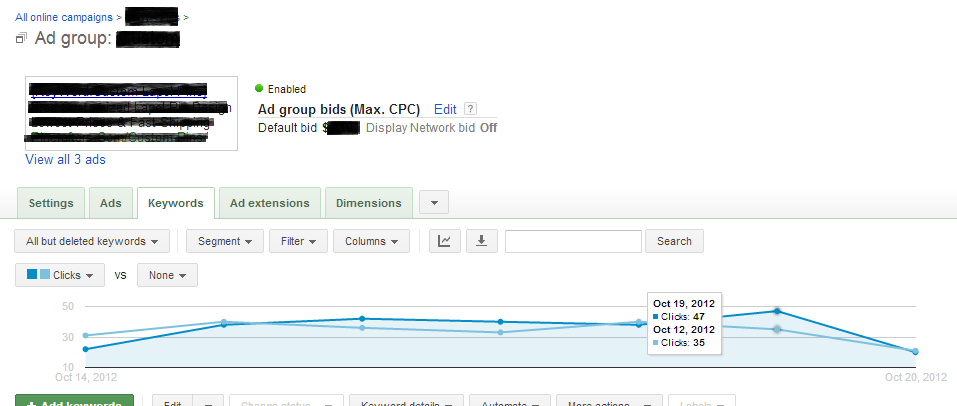
Drilling down one more step, you can also access these graphs with date comparison at the individual ad group level, but that's as deep as it goes:

You may have noticed that this graph looks a little simpler because it only contains 2 lines, rather than 4 (like in the first 2 screenshots), but that's simply by virtue of the fact that I only chose one metric - clicks. You're able to choose up to 2 metrics to compare, and I just happened to compare clicks to conversions in the other examples. There are actually a total of 4 metric categories, each with a variety of metrics you can choose from:
- Performance:Clicks, Impr., CTR, Avg. CPC, Avg. CPM, Cost, Avg. Pos.
- Conversions:Conversions (1-per-click), Cost / conversion (1-per-click), Conversion rate (1-per-click), View-through Conversions, Conversions (many-per-click), Cost / conversion (many-per-click), Conversion rate (many-per-click)
- Competitive Metrics: Relative CTR
- Google Analytics: Bounce rate, Pages / visit, Avg. visit duration (seconds)
The weird thing is, I can't seem to make any of the Competitive Metrics or Google Analytics metrics work. The fact that the Google Analytics metrics aren't working is particularly puzzling because I know these accounts are properly linked and sending data to Analytics, as well as receiving conversion data back. Perhaps these comparison metrics features in Adwords are still in Beta? They aren't labeled as such, and it would seem weird for Google to silently launch something that doesn't work, but at the moment I'm not seeing any other logical explanation.
Setting aside parts of this new feature that don't seem to work at all, I want to reiterate my main complaints - forced daily comparisons with no option to compare aggregate data and no percentage change data. I would say I'm surprised that Google would roll out a feature that isn't quite ready for prime time, but then again, they need to leave room for "improvements" in the future. Okay, I admit that sounds a little conspiratorial, but I really often if adding features piecemeal isn't a deliberate strategy to leave users feeling like they're constantly evolving and coming up with new ideas, when in reality many of these ideas may have been in the hopper for months or years, just waiting to be rolled out. Or, we could believe that one of the most successful and innovative companies the planet has ever seen is somehow simultaneously shockingly inept.
Whatever the reason, this feature is currently better in theory than it is in execution, but I'm holding out hope that they'll eventually get it right. In the meantime,
send us a message today if you need help optimizing your Adwords campaigns, or even if you're just looking to have your first campaign set up.
 In the screenshot above you can see both the new "Compare dates" option and the new look of the calendars, as well as the resulting graph that is created. Unfortunately, that graph is the only place we're shown comparison data, and you have to mouse over each individual day to see daily comparison's. There's no way, for example, to compare metrics from September to August in the aggregate - it's all daily. But I think we can all agree that daily comparisons won't tell us much (we could be comparing different days of the week, holidays to non-holidays, etc.), and we get a much better sense of Adwords campaign performance by looking at larger data sets.
Before I commence further whining about this *feature*, let's take a look at a screenshot of one of these graphs when you're drilled down to an individual campaign and mousing over a date:
I'm thrilled to see a substantial increase in clicks and conversion last Wednesday over the previous Wednesday, but what was the percentage increase? Having some change data is obviously better than nothing, but why couldn't they have included green and red increase/decrease percentages like we have access to in Analytics?
Drilling down one more step, you can also access these graphs with date comparison at the individual ad group level, but that's as deep as it goes:
You may have noticed that this graph looks a little simpler because it only contains 2 lines, rather than 4 (like in the first 2 screenshots), but that's simply by virtue of the fact that I only chose one metric - clicks. You're able to choose up to 2 metrics to compare, and I just happened to compare clicks to conversions in the other examples. There are actually a total of 4 metric categories, each with a variety of metrics you can choose from:


